CONFIGURE YOUR ODAMAP INSTANCE
![]()
### clone the repository
git clone https://github.com/etalab/dashboard-aides-entreprises.git

### go to frontend folder and copy default environment variables
cd frontend
cp .envExample .env

### shortcut to install ODAMAP
npm install
npm run dev
And then you could open your browser at
http://localhost:8000/
and you should have the following page appearing...
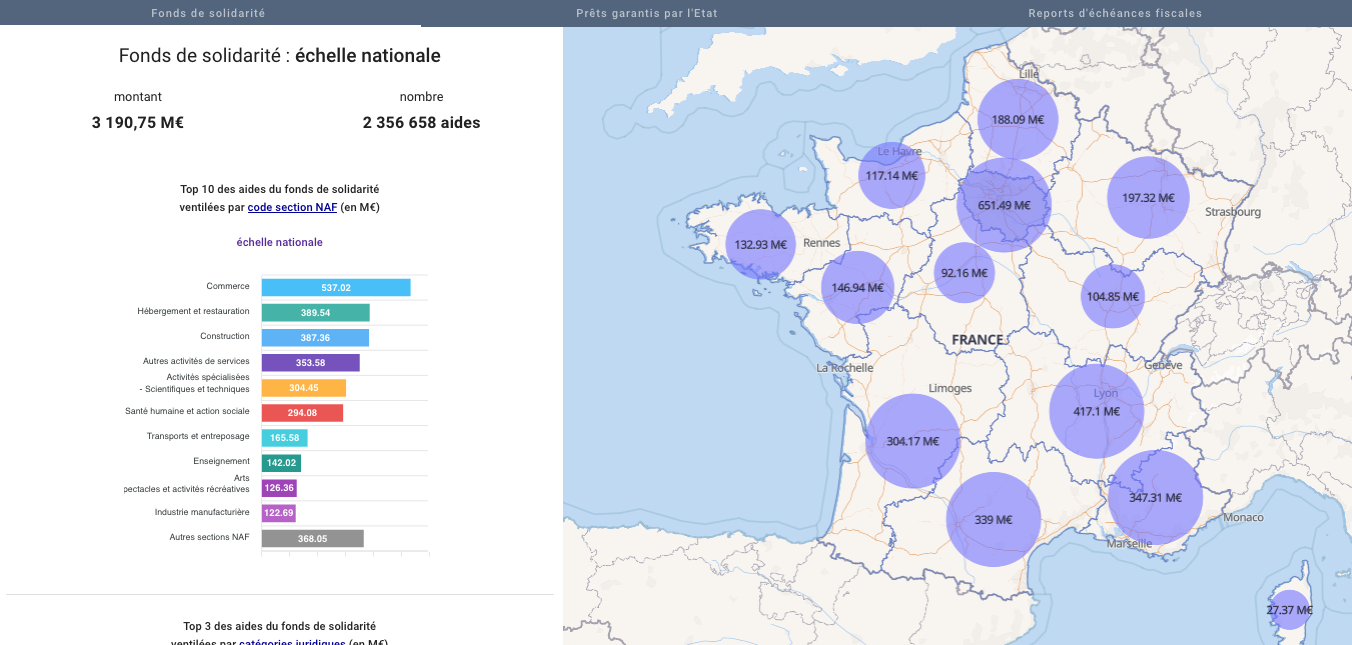
Some previews of what your custom ODAMAP instance should look like…
Developers / roadmap
ODAMAP is designed to help you visualize datasets - and particularly geocoded datasets - in an interactive dashboard.