ODAMAP is designed to help you visualize datasets - and particularly geocoded datasets - in an interactive dashboard.
INTRODUCTION
The French government has a strong policy towards open data, so citizen could access more easily to data produced by every branch of the state or local governments. This policy is coordinated by the Etalab mission
Most of datasets opened by the state, by local governments, and by some members of the civil society are nowadays published on data.gouv.fr.
During the 2020 covid-19 crisis ODAMAP was developped in an emergency as part of the government’s will to communicate on public efforts to help the private sector in a time of economic uncertainty.
More on the history of development of ODAMAP following this link.
To help citizen and administrations to highlight and navigate some datasets, or groups of datasets relative to a common topic, we developped ODAMAP. This 100% open source project basically propose some veery common and basic features any other dattavisualisation website / service could propose : interactive maps, interactive charts, custom texts, custom colors…
ODAMAP’S MAIN GOALS
- Help citizen and administrations to highlight and navigate open data ;
- Facilitate the circulation of open data ;
- Simplify and lower the costs of deploying a dashboard ;
More details about the reasons that lead us to we developped ODAMAP here.
ODAMAP’S MAIN FEATURES
ODAMAP includes “out-the-box” a website generator to create an original datavisualisation website from scratch and without backend.
ODAMAP main features are the following :
- “single-page app” (SPA) developped with Vue.js/Nuxt.js) ;
- map views (with Mapbox-GL) ;
- chart views (with) ApexCharts ;
- mobile responsive ;
- iframe integration possibility ;
- ability to load external contents like text/html ;
- routable urls (routes and url parameters) ;
- can display several datasets (locally from statics or distant) ;
- internationalization (with i18n);
- fully customizable ;
CUSTOMIZATION
Configuration files
ODAMAP aims to be fully customizable, but also to still remain simple enough to be reused by a community of developpers. This customizabilization relies (for the moment) on several configuration files you’ll need to familiarize with.
More documentation about that topic on this page
ARCHITECTURE
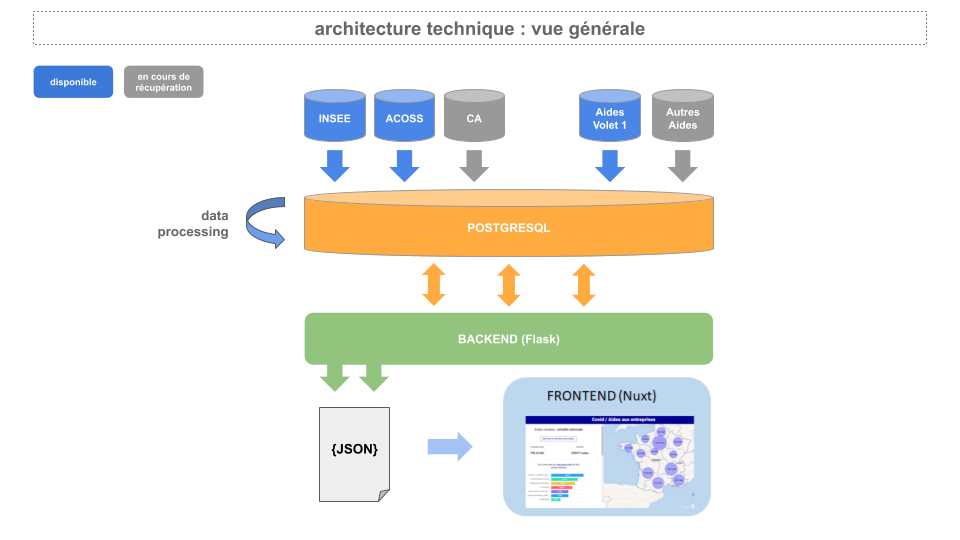
For now ODAMAP is the frontend part of a bigger project aiming to display specific datasets concerning economic response to covid-19 crisis, but is not limited to those datasets.
General overview
ODAMAP is the frontend part of several tools “crunching” data. This part is mainly written in python.
More documentation about that topic on this page
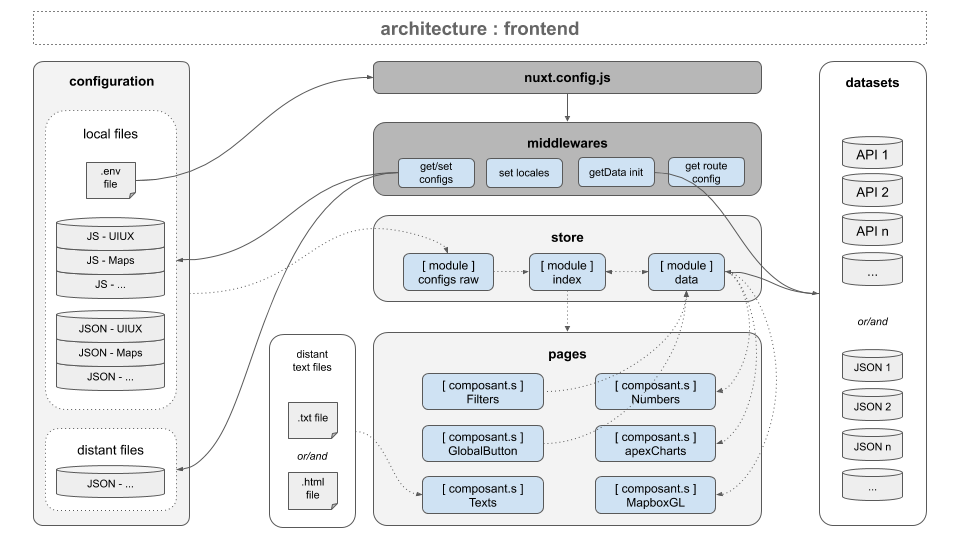
Frontend overview
ODAMAP app heavily uses the Nuxt framework, and its components/middlewares are more-or-less organized as follow :
More documentation about that topic on this page