CONFIGURATION - MAPS
Config files
File location
frontend
│   README.md
│   .env
│   nuxt.config.js
│
└─── configs
    │
    └─── dev
        │
        └─── appConfigMap.js
The MAPS configuration file
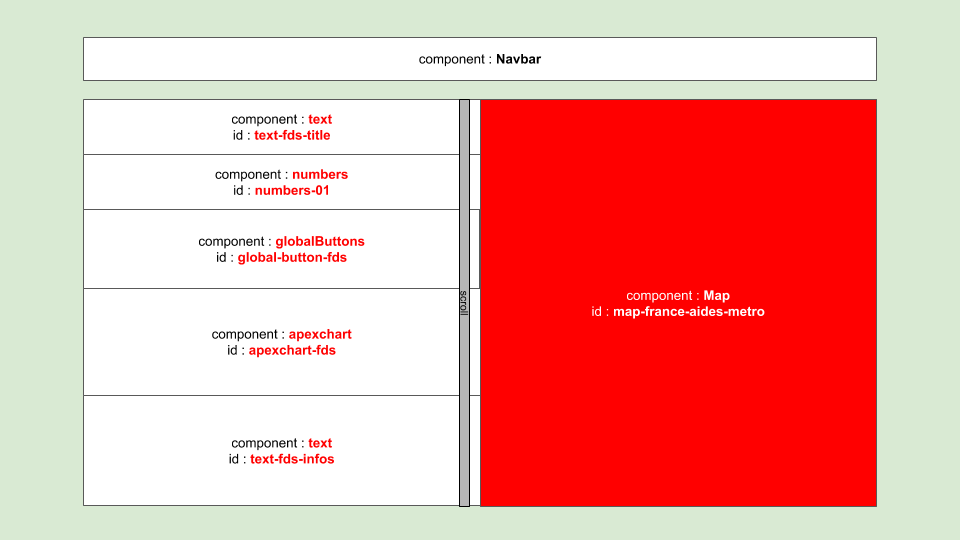
The appConfigMap.js file manages the maps you will display in your instance.
This .js file can be changed in development mode, but it will usually be transformed into a .json file. The later will be stored in frontend/static/configs/.
The ODAMAP’s Map component heavily relies on Mapbox-GL.js API and uses the vue-mapbox wrapper for Vue.js. Please read their documentation.
The most important parts of a map setting are the following :
- the
sourcesfield. This field is more precisely described below here. - the
mapsfield. This field is more precisely described below here. - the
layersfield. This field is more precisely described below here.
Global parameters
{
  "help" : help string for developpers,
  "settingsIds" : [
    ### **list** of <map settings>

    ### Example of a map settings
    {
      "id" : '',
      "isActivated" : '',
      "titleI18n" : '',
      "map_options" : '',
      "sizes" : sizes ,
      "sources" : [
        # **list** of sources...
        # see -sources- paragraph below
      ],
      "maps" : [
        # **list** of layers groups and clic events...
        # see -maps- paragraph below
      ]',
      "layers" : [
        # **list** of layers...
        # see -layers- paragraph below
      ],
      "maps_visibility" : {
        "title" :  ,
        "is_activated" : ,
        "is_drawer_open" : ,
        "map_switches" : ,
      },
      "copySettingsFrom" : [
        # **list** of fields to copy from other map settings
        {
          "copyFromId" : 'map-france-report-metro',
          "fieldsToCopy" : [
            # **list** of keys to copy
          ]
        }
      ]
    }
    ### end of the example

  ]
}
The sources field
In the sources section your map component will know which dataset it will need to load onto the map.
For data sources loading in general you can see this page
The component can load external sources (like a distant geojson file or a geojson file in the static folder), OR can load data from the vuex store and transform it to geodata (like changing a list of rows in a csv to a marker on the map).
{
  "sources" : [

    ### example of a geojson source
    {
      "id": 'regions',
      "help": 'geojson des contours des régions',
      "from": 'url',
      "url": '/datasets/geodata/regions-1000m.geojson', // local file in `/static` folder
      "type": 'geojson',
      "generateId": true,
      "licence": 'open licence',
      "loadInStore": true,
      "popupSettings": true
    },

    ### example of a dataset source loaded from store
    ### and then transformed into geojson
    {
      "id": 'regions-aides',
      "help": 'montants des aides au niveau regional - as geojson from raw',
      "from": 'store',
      "fromId": 'regions-aides-raw',
      "type": 'geojson',
      "generateId": true,
      "needTransform": true,
      "transformTo": {
        "srcKey": 'reg',
        "geoCanvasId": 'centers',
        "canvasKey": {
          "keyIsFieldName": true,
          "field": undefined,
          "canvasKeyPrefix": 'REG-',
          "canvasKeySuffix": ''
        },
        "properties": aidesProperties,
        "geometry": {
          "type": 'Point'
        }
      },
      "licence": ''
    }

  ]

}
The maps field
In the maps section your map component will know how layers should behave when clicked upon…
{
  "maps" : [

    ### example of a map
    {
      "id": 'map-aides-reg',
      "name": 'Carte aides par région',
      "category": 'regional',
      "properties": 'aides',
      "data": 'aides',
      "layers": [
        # **list** of layers id
        'regions-fill',
        'regions-lines',
        'regions-aides',
        'regions-aides-montants'
      ],
      "clicEvents" : [
        # **list** of clic events/functions

        # example of a clic event description
        {
          "funcName": 'goToPolygon',
          "help": 'fly to polygon',
          "funcParams": {
            "zoomRange": {
              "minZoom": undefined,
              "maxZoom": 9
            },
            "propName": 'code'
          }
        },
        # end of clic event example

      ]
    }
  ]
}
The layers field
In the layers section your map component will apply styling to your data and geodata…
Please read the mapbox-gl documentation about layers to understand the how to customize your maps.
{
  "layers" : [

    ### example of a mapbox-gl layer settings
    {
      "id": "regions-fill",
      "type": "fill",
      "source": "regions",
      "layout": {
        "visibility": "visible"
      },
      "paint": {
        "fill-color": [
          "case",
          [
            "boolean",
            [
              "feature-state",
              "selected"
            ],
            false
          ],
          "#572a99",
          "#526781"
        ],
        "fill-outline-color": "#627BC1",
        "fill-opacity": [
          "case",
          [
            "boolean",
            [
              "feature-state",
              "selected"
            ],
            [
              "feature-state",
              "hover"
            ],
            false
          ],
          0.15,
          0
        ]
      }
    },
  ]
}